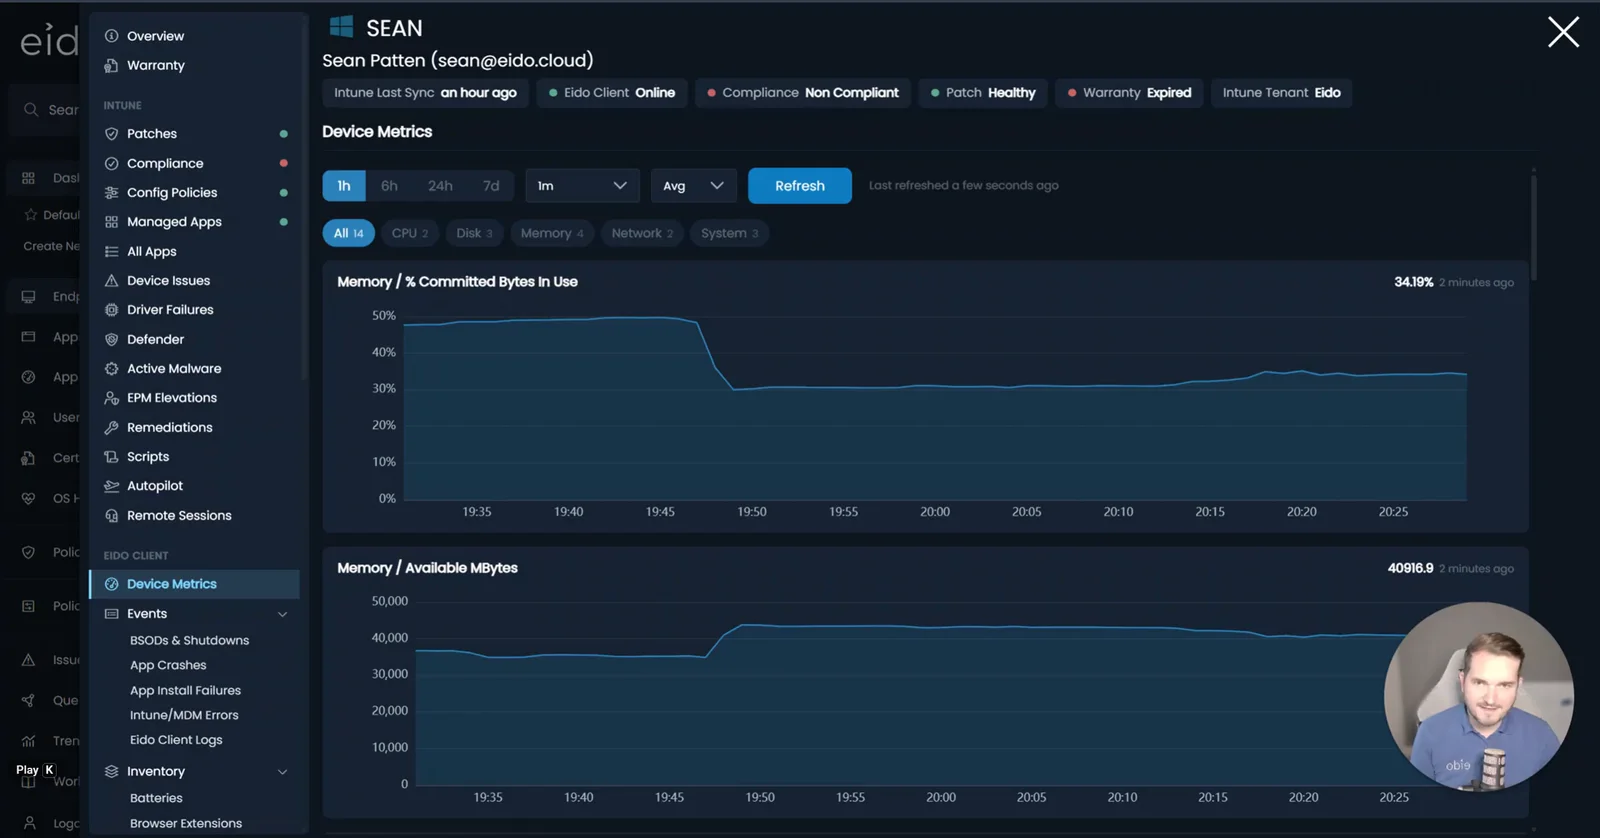
Live performance
See CPU, memory and disk behaviour while the issue is happening, sampled as often as every three seconds. Diagnose intermittent problems without waiting for another check-in or asking the user to recreate them.
Intune tells you what happened. Eido tells you what is happening.
Intune’s scheduled check-in comes round about every eight hours. A lot can happen in between: by the time a support ticket reaches your team, the problem may already have disappeared.
Eido gives you a live view of the device, so you can see what is happening, spot recurring issues and investigate without asking the user to recreate the problem.
The Eido Client adds live performance, deeper device information, events and support tools to your existing Intune environment. Open a device in Eido and the context you need is in one place.
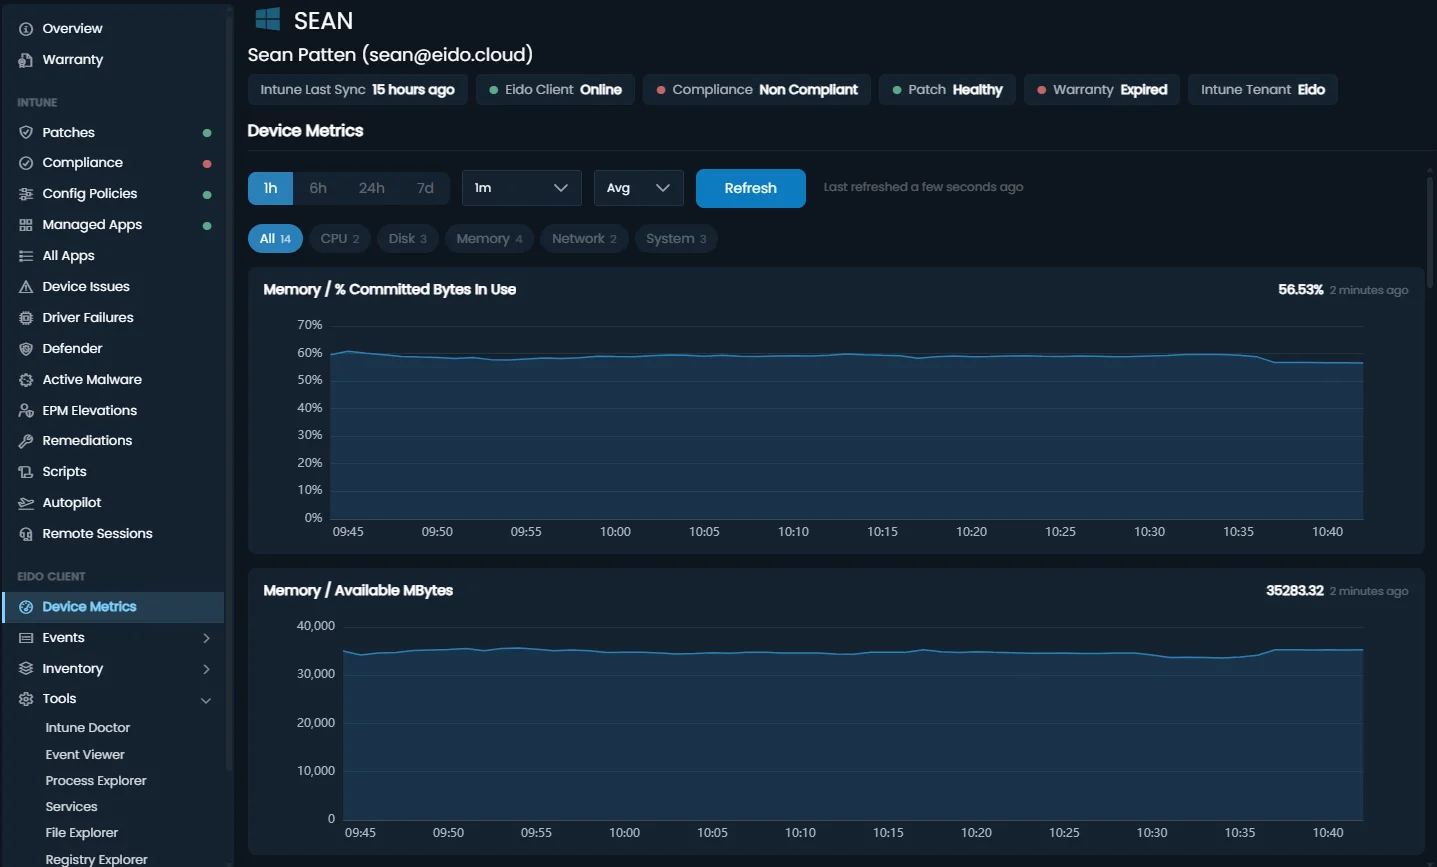
See CPU, memory and disk behaviour while the issue is happening, sampled as often as every three seconds. Diagnose intermittent problems without waiting for another check-in or asking the user to recreate them.
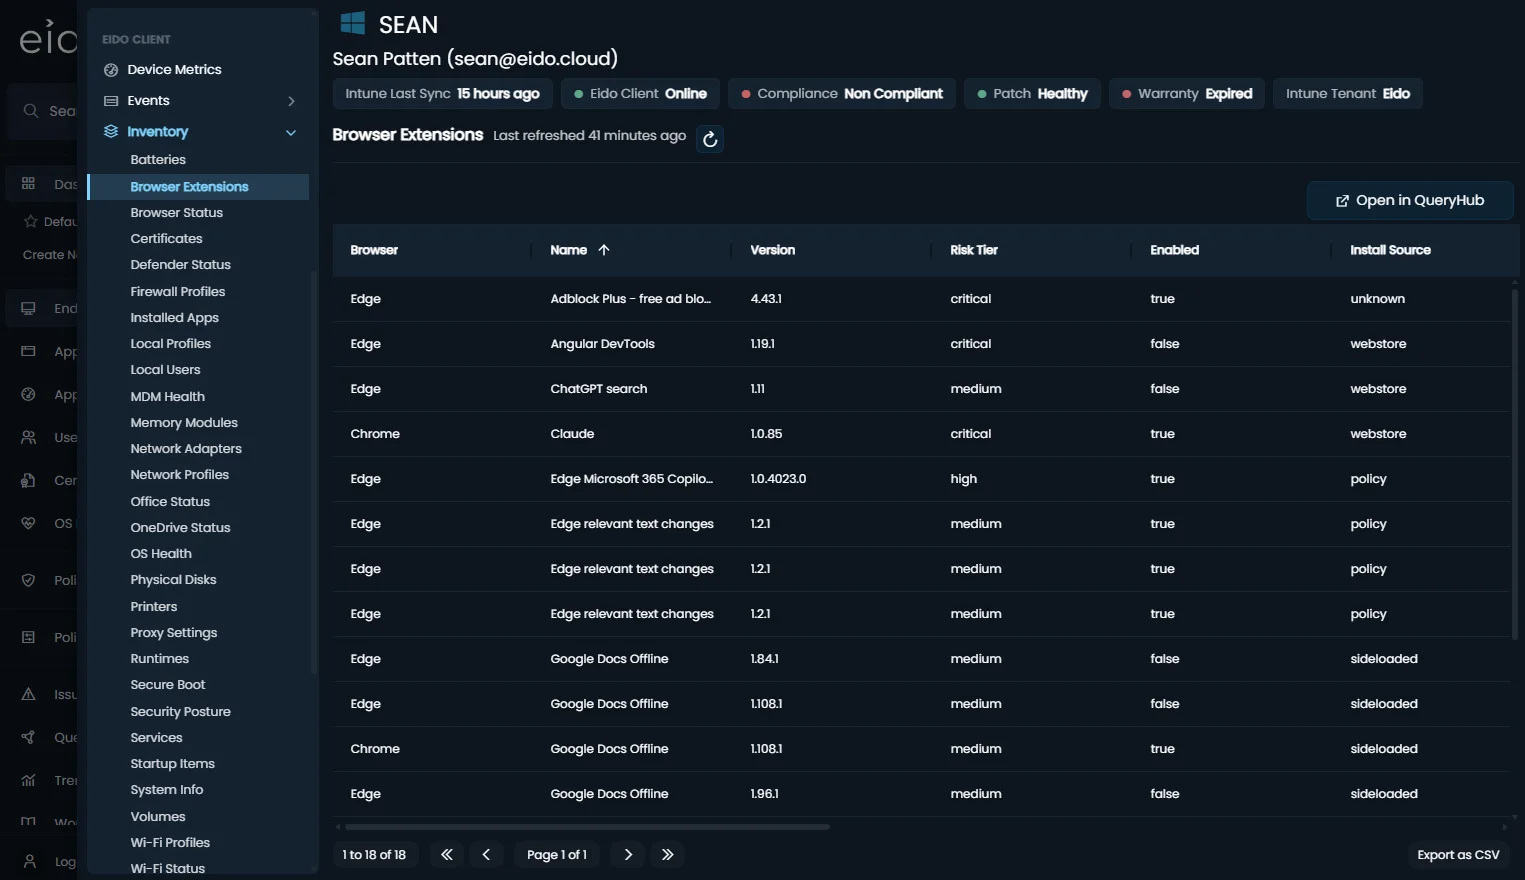
Apps, patches, hardware and key configuration details in one place, refreshed as often as every 15 minutes. Useful for support, audits, rollouts and device refresh planning.
Application crashes and hangs, blue screens and unexpected shutdowns are reported every five minutes. Spot recurring problems earlier and investigate with the relevant device context already there.
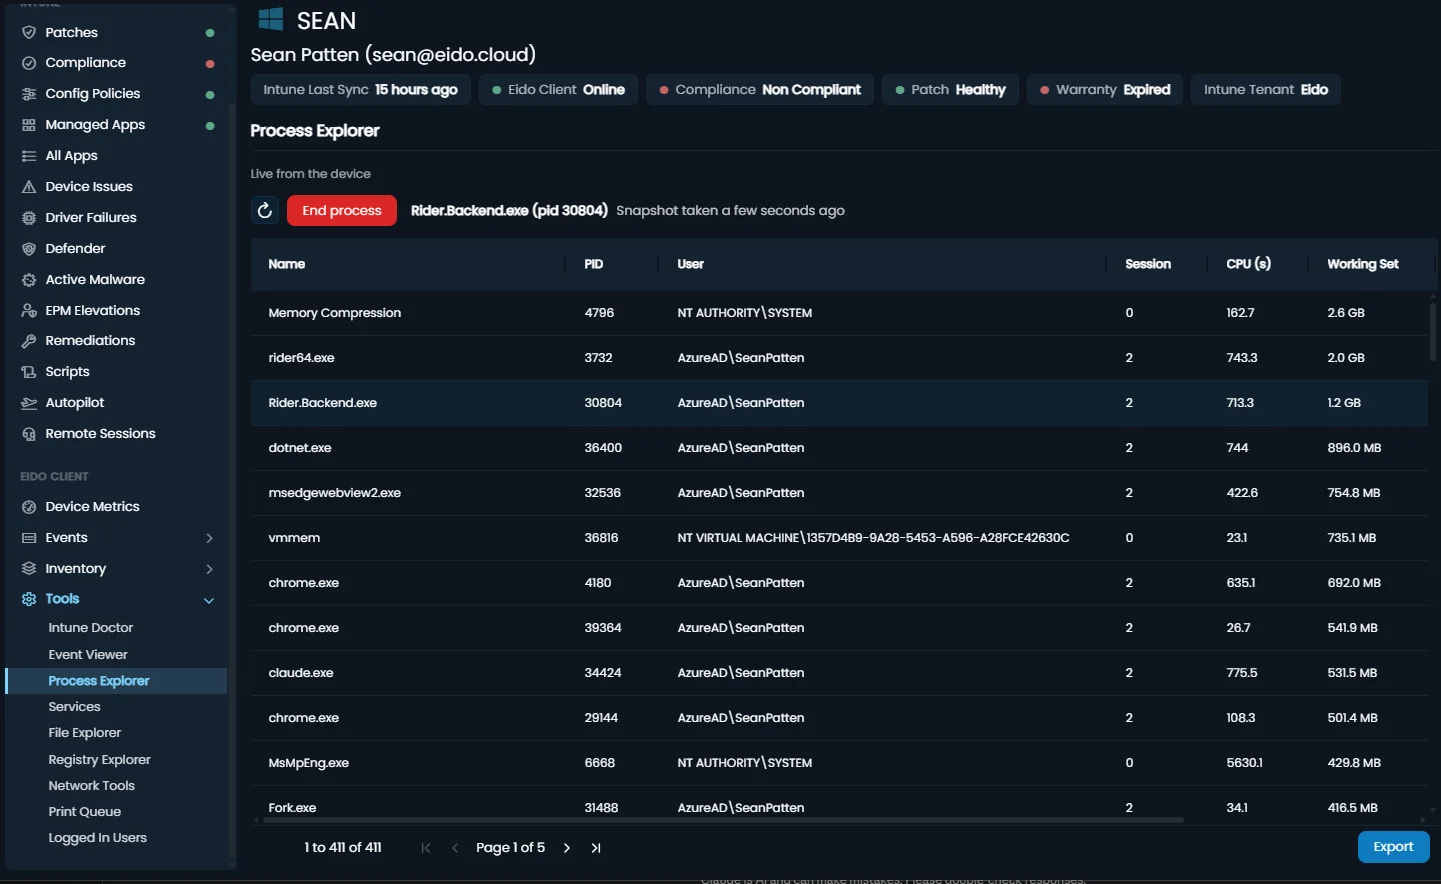
Check processes, services, event logs, files and more from the device page. Resolve common issues without taking over the user’s screen.
Open the device, see what is wrong and take action from the same page. Restart a service, inspect an event log, clear a stuck print queue or check a running process without starting a remote session or interrupting the user.
Access is controlled per customer, with write actions disabled by default.
A current view of hardware, software, security and configuration across your Windows estate, refreshed as often as every 15 minutes. When you are troubleshooting an issue, planning a rollout or answering an audit question, the information is already there.
Read-only is the default, sensitive actions require additional authentication and remote changes are logged.
Write actions stay off until you deliberately switch them on, per customer.
Risky actions force a fresh Entra ID sign-in before they run.
Every device authenticates with its own non-exportable certificate. No shared secrets.
The agent refuses to touch Defender, the firewall and critical system processes.
Repeated failures or suspicious activity shut the channel down automatically.
Every remote action is logged: who ran it, on which device, and when.
It ships as an MSI, so most teams push it as a Win32 app through Intune. An RMM tool, a script or a manual install work too. Enrolment uses a one-time token, and from then on the device identifies itself with its own certificate. No passwords or shared secrets are stored on the endpoint.
Outbound only. The Eido Client does not accept inbound connections. Platform traffic uses HTTPS, while live metrics use Azure IoT connectivity. If the live metrics connection is blocked, the rest of Eido continues to work.
The Eido Client is designed to have minimal impact on the device. Normal sampling is lightweight and increases only while somebody is actively viewing live performance. Live metrics are requested on demand rather than continuously uploaded.
No. Intune remains responsible for device management, policy and configuration. The Eido Client adds the live visibility and support tools that sit alongside it, so you can see more of what is happening on the device and act faster when something goes wrong.
You choose a region at onboarding: UK, EU or US, and your data stays in that region. Recent performance history is held on the device itself, and event history is retained in the platform.
AI diagnostics can only run approved, verified scripts from a controlled library. There is no free-form command line, and every execution is logged, rate-limited and subject to the same device protections as other live actions.
In 15 minutes, we will show you live performance, current inventory and the support tools in action, so you can see exactly what Eido adds to Intune.